
Tenable One empowers security teams to go beyond surface-level risk tracking and drive measurable improvements across their security programs. With unified visibility and customizable dashboards, Tenable One makes it easy to monitor the KPIs that matter most, helping teams shift from reactive firefighting to proactive, strategic exposure management.
The importance of KPIs in exposure management
Effective exposure management isn't just about identifying risks — it's about continuously measuring and reducing real exposure. Key performance indicators (KPIs) provide security teams with critical visibility into program effectiveness, helping them prioritize actions, monitor progress and ensure alignment with broader business objectives.
In this blog, we’ll highlight the top KPIs Tenable One customers track to reduce risk, accelerate remediation and demonstrate impact to stakeholders.
Essential KPIs for effective exposure management
1. SLA performance metrics
Tracking service level agreement (SLA) performance is crucial for understanding how consistently your organization meets its remediation targets. This provides insight into whether your security team is keeping pace with exposure management commitments or if risk is accumulating across specific asset groups.
-
SLA Compliant Assets Over Time: This metric offers visibility into how well your organization is meeting its remediation goals. It highlights which areas are effectively keeping up with exposure resolution and where unresolved risks may be building up.
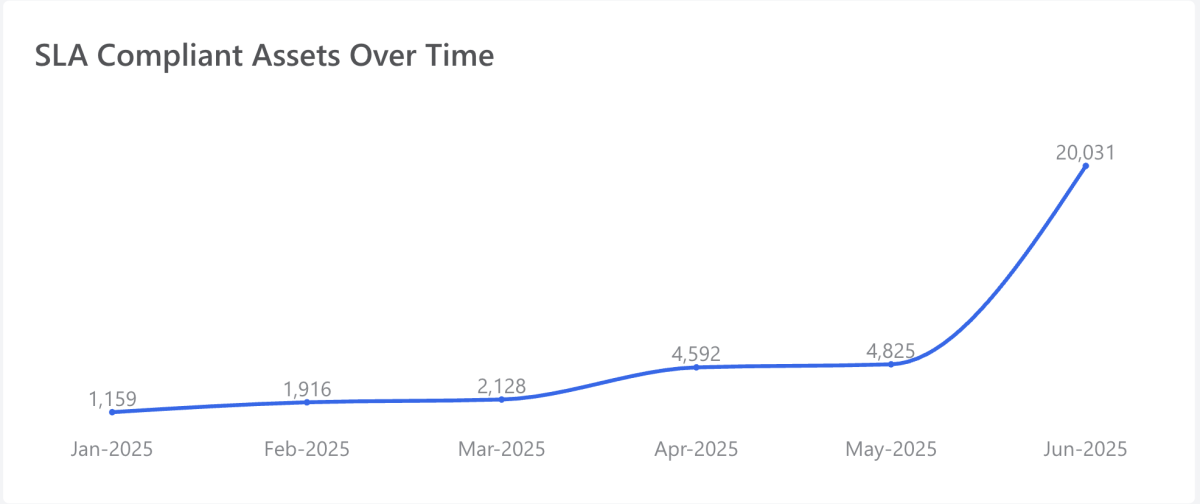
Tenable One dashboard widget
-
Top Critical and High Detections by Number of Findings Exceeding SLA: These metrics highlight growing technical debt — findings that remain unresolved beyond their expected timelines, increasing your organization's risk exposure. Consistent tracking allows for early detection of bottlenecks, ownership gaps, or resource constraints before they lead to larger, more challenging risks. By tracking findings approaching SLA, teams gain a proactive view, enabling them to act on critical assets — either through remediation or mitigation – before SLA breaches occur.
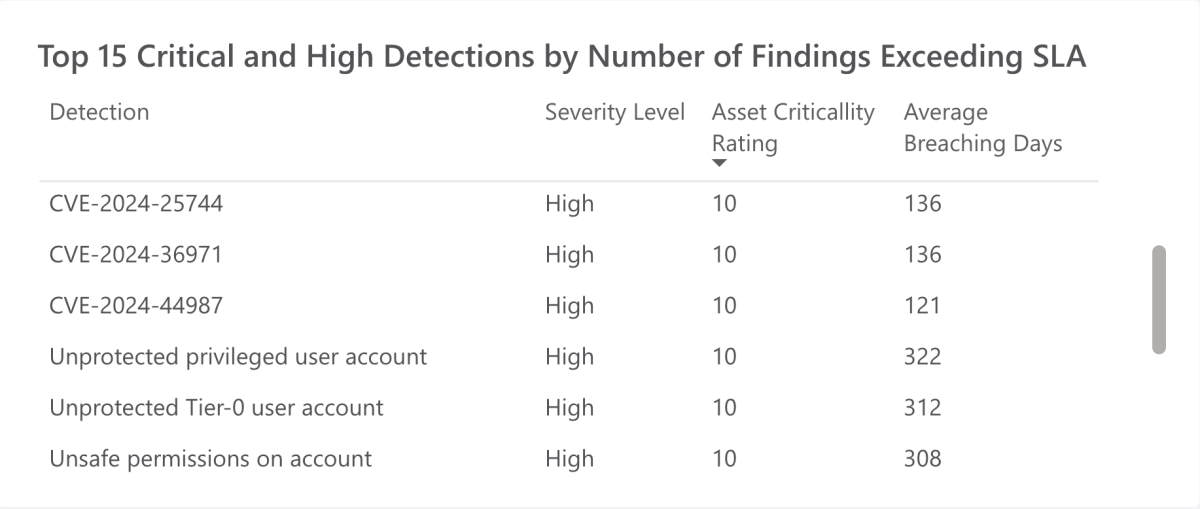
Tenable One dashboard widget
Monitoring trends in these KPIs allows organizations to identify periods of declining compliance and pinpoint areas requiring immediate attention.
2. Risk posture and exposure trends
A holistic understanding of your organization's risk posture and evolution over time is fundamental to strategic exposure management.
-
Cyber Exposure Score (CES) Over Time: This metric provides a high-level view of your organization’s total risk exposure. It aggregates risk across all assets, reflecting how the attack surface evolves and whether remediation efforts are effectively reducing overall risk. Monitoring CES trends helps your security team understand the direction of their risk posture — whether it's improving, plateauing, or worsening — and serves as a strategic signal for leadership.
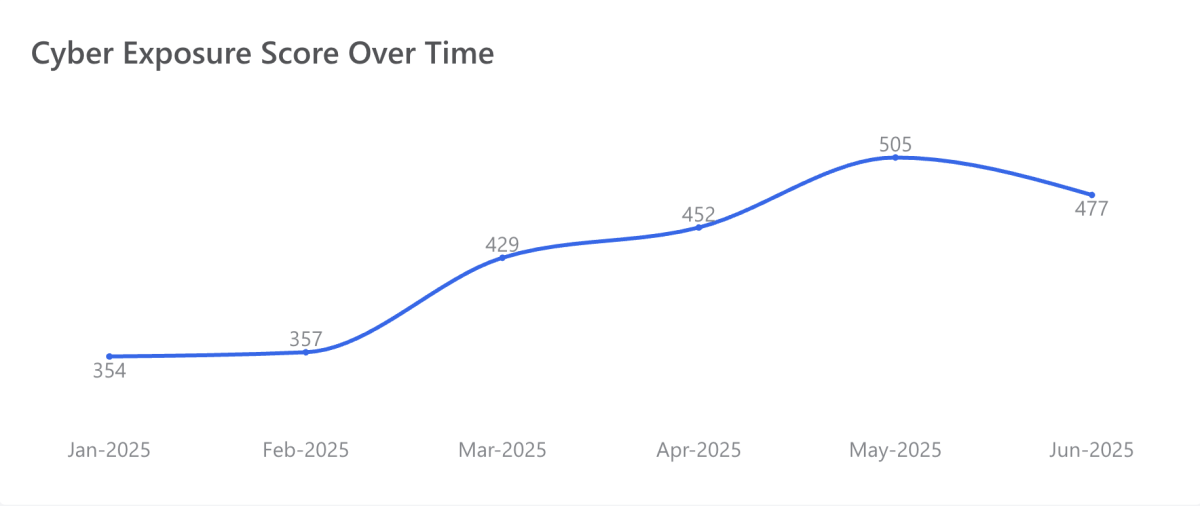
Tenable One dashboard widget
-
Assets Exposure Score by Exposure Category (VM, OT, Cloud, etc.): This metric allows you to compare risk posture across different technology stacks, prioritize remediation efforts and allocate resources to areas with the highest average exposure.
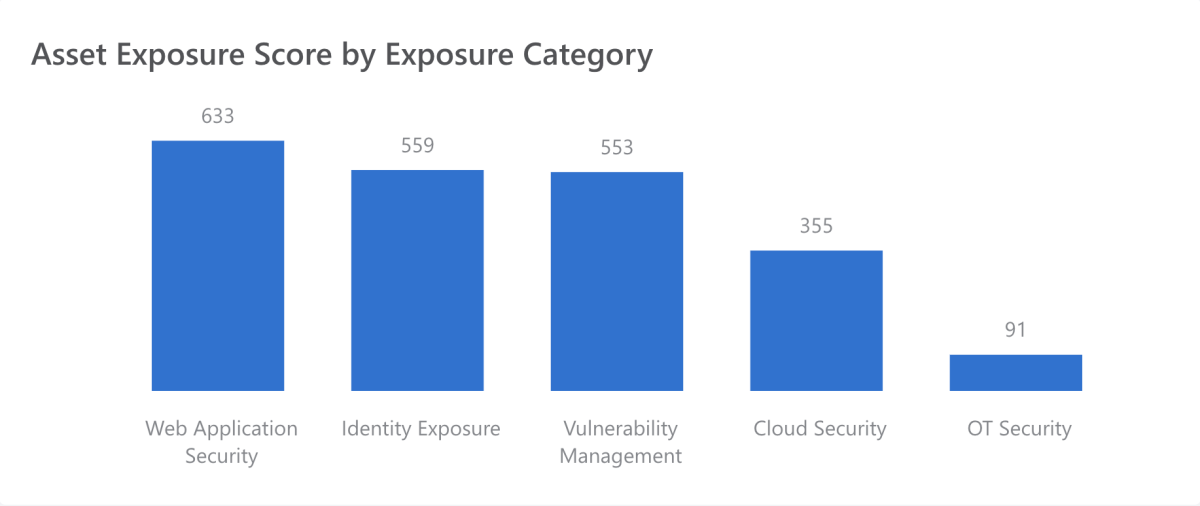
Tenable One dashboard widget
-
CES Exposure Score by Exposure Category and Asset Type: This metric helps identify whether specific asset types within a category disproportionately contribute to cumulative risk, facilitating precise action and enabling data-driven decisions on resource allocation.
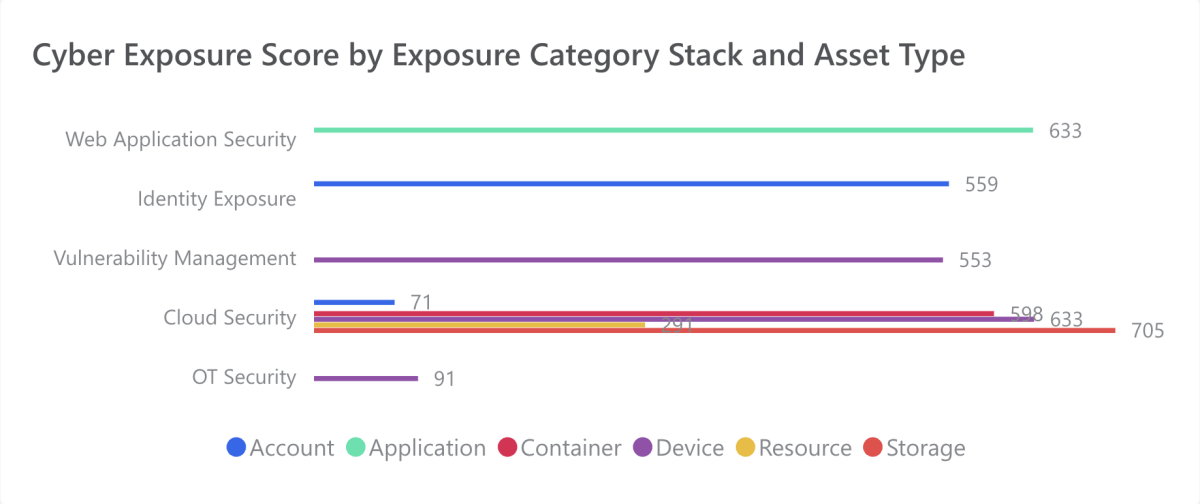
Tenable One dashboard widget
Tracking these metrics enables data-driven decisions on resource allocation. It allows for drill-downs into contributing assets and exposure categories, ensuring your efforts are always aligned with the most critical risks.
3. Remediation KPIs
Effective remediation tracking is critical to ensuring weaknesses are not merely detected but addressed promptly and consistently. This category of KPIs focuses on measuring the efficiency of vulnerability resolution, tracking how long issues remain open and identifying potential delays or regressions.
-
Findings by State Over Time: This metric illustrates the progression of findings through "Active," "Fixed," and "Resurfaced" states over time. It offers visibility into remediation volume, closure rates and recurring issues. A steady increase in resurfaced findings can indicate incomplete fixes or recurring vulnerabilities due to configuration drift or asset churn.